
Sean Daniel
Technical Product Leader
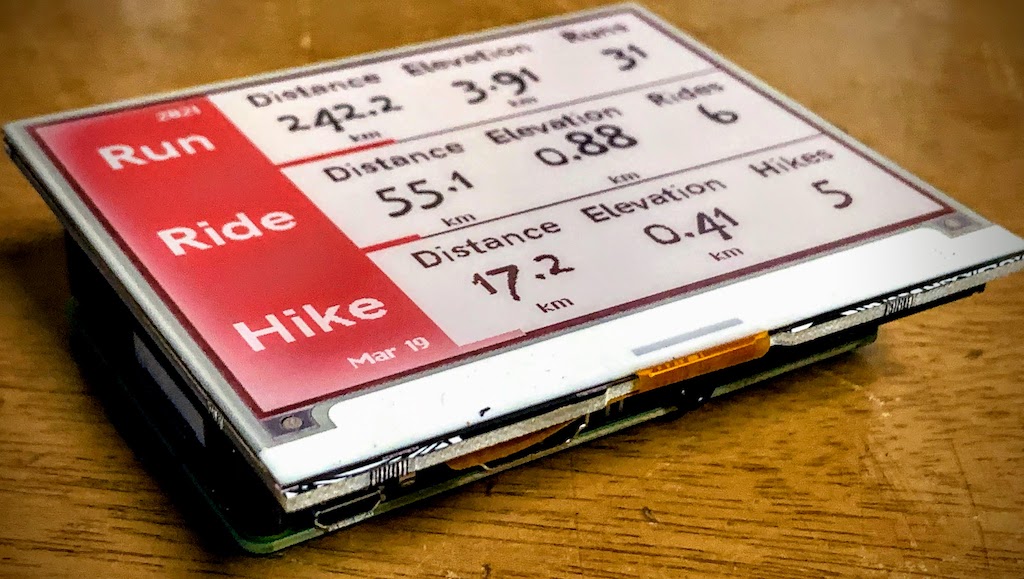
Inky Strava
This project calls the Strava API using to obtain details about runs, bikes and hikes and then displays them on an Inky wHAT paper/e-ink display. The graph is updated once a day. The idea for this project came from a reddit mileage monitor post.
Hardware

The hardware set up for this project was pretty easy, it was just a Raspberry Pi 3b+ and an Inky wHAT display.
The redditor that I got the idea from used a smaller version of the display called the Inky pHAT which one could argue is the flagship screen for Inky. This code doesn't run on that screen. Well.... it would but more than 1/2 of the data would be missing.
Software
My language of choice for the project was NodeJS. However there wasn't great support for the Inky displays using anything other than Python. Someone did have an NPM library but I found it very limited versus the provided Python libraries.
This was my first time learning Python, and I have to say while it seems pretty powerful, I'm not a fan of indentation based languages. I feel like indentation should be use to make your code clear, not make it function. As such the Python code isn't the "prettiest" and the code isn't as D.R.Y. as it should be. Probably needs a revisit at some point.
How it works
On a daily basis (9am computer time) a node-schedule job will wake the program up, it will authenticate to Strava with the refresh token to obtain an access token. Once an access token is obtained, it will call for the activities that happened after the start of the current year, or after the last time it called Strava (as not to pummel their API and get you in trouble).
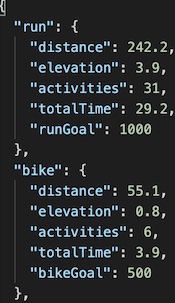
On first start, the script figures out the start of the current year, and creates a new file in the /data directory. Then using the Strava Authentication file it calls Strava and downloads all activities from the start of the year and sorts them into Run, Ride and Hike (discarding the other activities such as walk, swim, etc). The data is then stored, along with the current time into the data file. On the next run (9am the next day) it will only query Strava for the changes since the last activity. The current year's data is stored in the /data/data-YYYY.json file and then it's displayed to the Inky e-Ink display.
Once a new year starts, a new file will be started and the display will start over.
The red bars progress along the bottom of each area in accordance to how close you get to the goals.
Try it for yourself
Want to try your hand at your own version? I've published the code to GitHub