
Sean Daniel
Technical Product Leader
Home Energy Monitoring
If you've been following my projects along, you'll know I have a bit of an obsession with Grafana, and it was time to make another useful dashboard. With some help from a co-worker (thanks Ari!), I was able to get to get some rudimentary home energy monitoring happening to along with that lovely weather data I've been collecting.
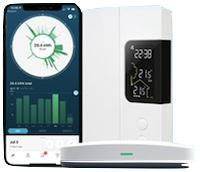
The first place to start was total home energy, which of course BC Hydro stores all of that data. Looking around for an API it was virtually impossible to get the data out of BC Hydro's website. However, they do offer an in-home device called the Hydro Home Hub which provides real-time energy usage.
The device uses an App to pair with the Hydro meter, the device has to be surprisingly close to the meter outside the house, so sadly I am running it on Wi-Fi. Once connected, the associated app will give you real-time usage savings suggestions and historical summaries. Pretty cool just with that, but tied to your phone and not in Grafana which wasn't the goal. This is the first place Ari helped me, by helping me connect to the Hydrohome Hub locally to read the data. It's not technically supported, so we'll see how long it lasts.
Getting into Zigbee
Now that I had total home usage, the goal was to get individual appliance usage. The first step was to get an MQTT broker up and running. Being no stranger to MQTT, I decided to jump in head first with the Docker image of Mosquitto. Pretty easy to set up, I just had to map the configuration file, and open the ports and it was running. The config file was hard to follow, but it's fairly well documented. Pro tip here was you need less configuration than you think!
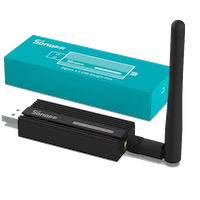
Based on a recommendation from Ari I went with a USB based bridge instead of a stand-alone one, it's far cheaper! I chose the Sonoff USB Dongle bridge to connect into my server. Then per Ari again, the best way to get the data into InfluxDB was to use Zigbee2MQTT open source app. This app runs as a Docker image, which got me excited to give it a go!
However, I had a lot of problems getting started with this app in Docker. This was because to the best of my knowledge, the Mac version of Docker does not support USB passthrough. As such, I decided to run it locally on the Mac instead, and found these instructions from Kinori which got it all working great!
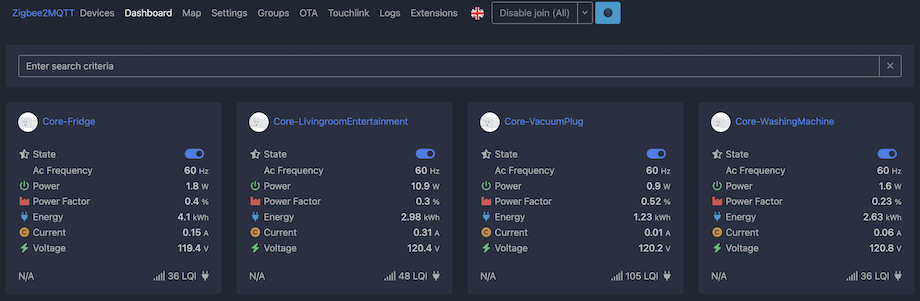
Lastly, I picked some Smart Plugs that would track energy usage. I was hoping for the Sonoff ones, but they are either Zigbee protocol without energy tracking, or Wi-Fi protocol with energy-tracking. So ultimately I ended up going with the Third Reality Smart Plugs that I found on Amazon. They connected to the bridge (once within the short range) pretty quickly and you can use the Zigbee2mqtt UI to rename and configure them. Specifically I want the default for these to be "on" after a power outage.
Collecting the Data in InfluxDB
Now the data was flowing from smart plug to the Zigbee bridge into MQTT broker, it was time to collect it in InfluxDB. I thought about writing a small NodeJS script that would run as a Docker image and collect the data, but I wanted to give Influx Telegraf a try. Partially because it's a new tool and partially because I want to collect many things in the future and this gives me a multi-purpose collection platform. I have to say the configuration was a giant pain, but now that it's configured, it's been solid.
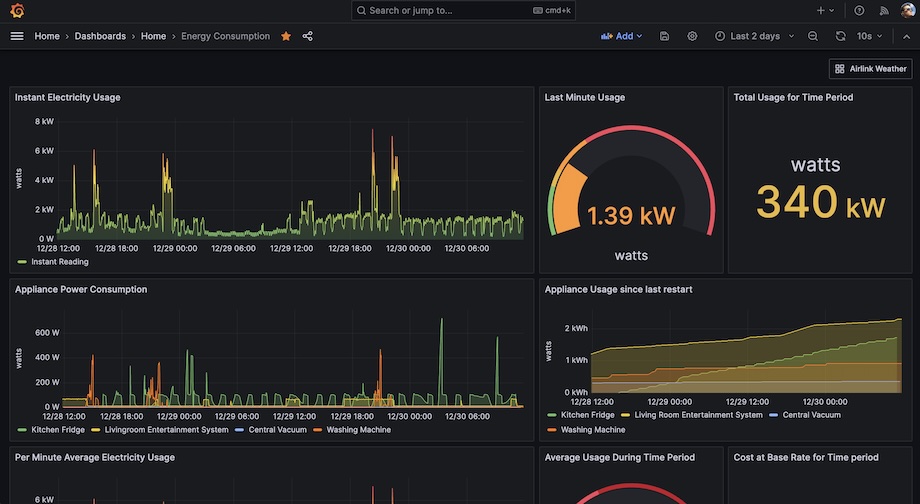
Once the data landed in InfluxDB, it was fairly straight forward to create a new energy monitoring dashboard in Grafana.
Misson Accomplished!
Naturally, I've now purchased a few more Zigbee sensors and have started to look at connecting devices together in my home using Home Assistant. But that is a project that will evolve later in 2024.