
Sean Daniel
Technical Product Leader
Davis Airlink with Grafana
After all the wildfire smoke in B.C over the last few summers, I decided to pick up a Davis Airlink Air Quality monitor. So far it's been great in telling me the Victoria area is pretty perfect. While I'm hoping we don't get any action this summer, I'm ready to monitor it if we do.
By default a Davis weather station sends data into weatherlink, which on the web is quite a powerful visualization tool. Sadly, I'm disappointed with the availability of historical data on the Davis Weatherlink iOS app. Which got me thinking if I could get the data into Grafana, which is quite a powerful visualization tool that is often used to monitor computer systems, but seems to be able to visualize any timeseries based information.
Hardware
In this case the hardware for this project was pretty simple. As usual I'm running my code on a Raspberry Pi 3b+, which is sufficient, although it's a tad slow. If I was able to get my hands on a Pi4, I would think it would run faster there, but globaly supply chain issues, etc. I'm sure I'll move it at some point.
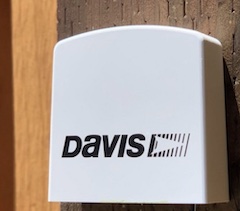
The other piece of hardware is a Davis Airlink. This is simply mounted outside (sheltered) and given standard power and connects to the house wi-fi. Once it's powered up, it's set up with the weatherlink app and it starts reporting.
Once it's online, you can look at your home network router and find out the airlink's local IP address. For me it was
http://192.168.1.20. It then provides you all the documentation you'll need! I'm doing everything local on my network so simply
using the Airlink Local API. This API
explains that you can hit that same IP address at http://192.168.1.20/v1/current_conditions and you will get
a JSON based response with the weather conditions explained in that Local API.
Software
Grafana is a visualizing and alerting platform, that supports reading from various databases. The common database and collection platform is Prometheus. The first thing to do is set this up on your Raspberry Pi. I followed these steps by My Tiny DC which is a step by step guide to getting this sytem running. As a side note, I also use Grafana to monitor all my Pi's as well as my Windows Server.
Once that is installed and running you will have loads of fun designing dashboards to monitor your running computers in your home, but that is not why we are here.
How it works
As usual, my language of choice for the project was NodeJS. Since Prometheus calls a website on a given schedule I wrote some middle-ware that Prometheus calls that in turn calls the Davis Airlink and then serves up the data. Using the NPM Prom-Client library I created a new client, then when it was called with an HTTP GET, I inturn use the NPM AXIOS library to call the Davis Airlink, parse through the JSON and populate the prom-client metrics, then I return the metrics to the Prometheus Server.
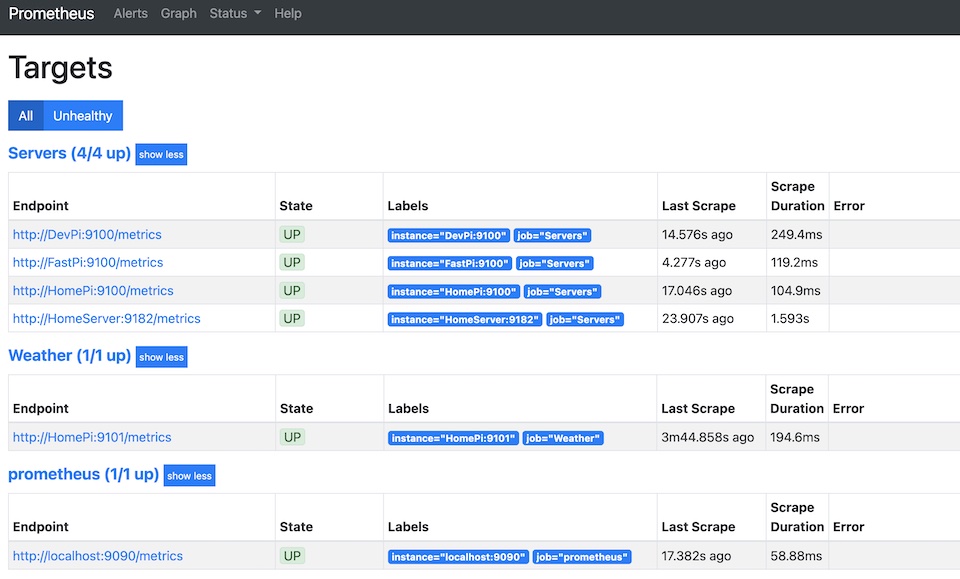
Once this serves up the data via the prom-client, you simply use the instructions to add another Prometheus target to monitor and the calling schedule, I'm using 300s (or 5 minutes) and the data will start coming into Prometheus and can be read by Grafana.
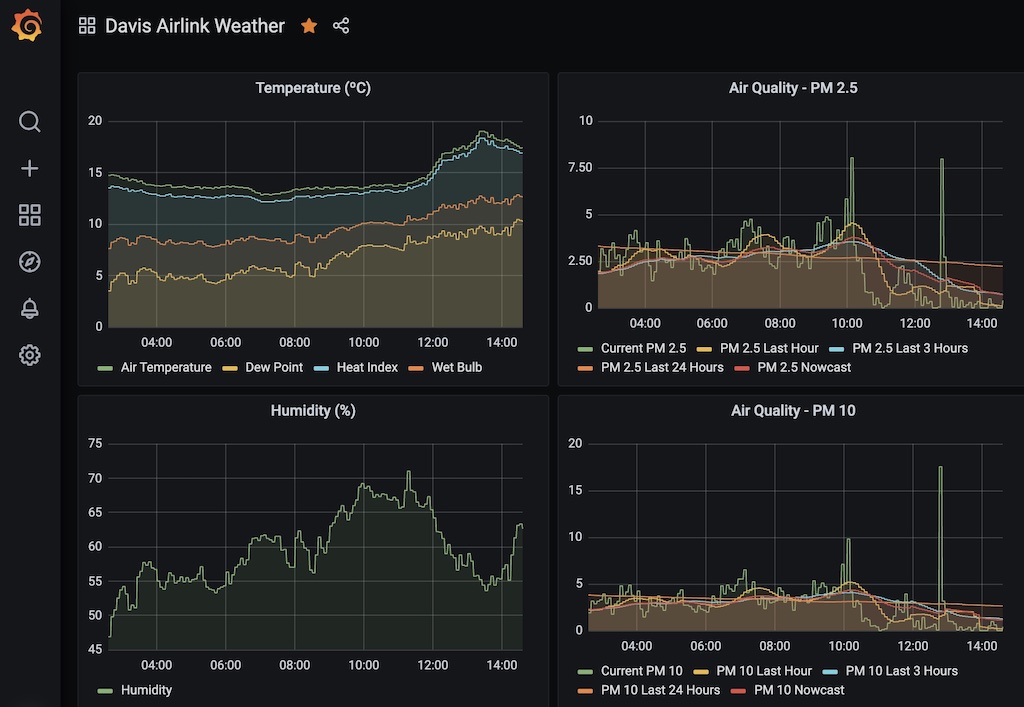
The last step is to build a custom dashboard. Create a new dashboard, add a panel and in the edit panel, add the metrics you want to display by simply typing them in, giving it a legend name and then adding the next one. Sure you can get pretty fancy in here. I've just started with the basics.
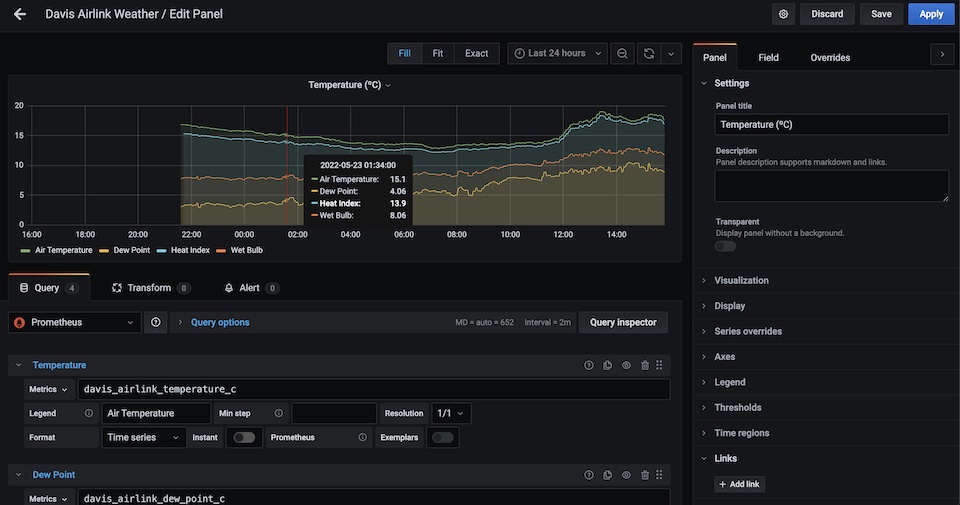
There is lots of room to explore and customize here. I'll stop there and let you get to it.
Try it for yourself
Want to try your hand at it? I've published the code to GitHub