
Sean Daniel
Technical Product Leader
Upgrades to the Davis Weather System
Last year I worked on collecting temperature, humidity and air quality data from my Davis Airlink Air Quality monitor. After seeing the data for almost a year now, I'm quite attached to it. However, the more I read about my raspberry pi, microSD and Prometheus set up, I realized how vulnerable that data was. It was this StackOverflow article that lead me to make a decision to change how I stored data.
A better solution was using Influx DB for data storage. I also figured this was a good time for me to spend more time understanding Docker, which I have had familiarity with through work but have always had things set up for me and I would just troubleshoot. In this instance though I wanted to learn a few things:
- How to set up Docker
- How to get and install public Docker images
- How to compile and run my own Docker image
- How to monitor Docker to ensure everything is still running
Setup & Public Images
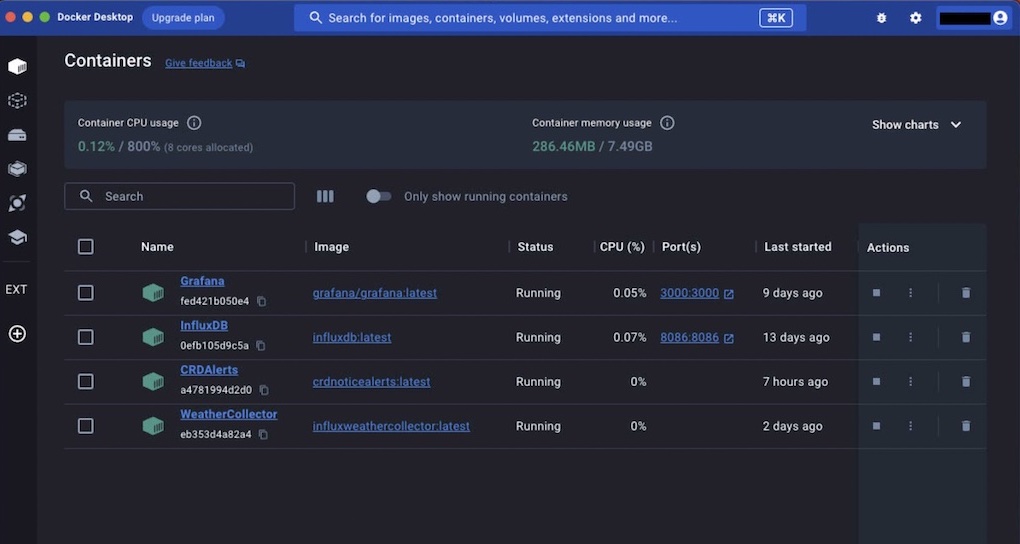
Obviously setting up Docker was pretty easy, its just an install. In this case I was using MacOS with an external Samsung SSD as my docker host. Docker provides a great public image search and finding InfluxDB and Grafana was a piece of cake. What was important as part of the set up was to run these images and find out what parts of the image where changing. This was important since mapping these folders to the external SSD ensures that your database and configuration files persist between docker image updates.
What's also interesting was the docker UI doesn't offer as much control as the command line interface (CLI). The key one was the automatic restart options.
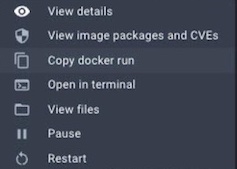
Additionally, the UI requires you to type everything in each time. A pro tip here was to do all the work in the UI and then copy the command line, and put it into a bash
script. This allows you to take the @latest version of the image and start it with all the name, port mappings, folder mappings, restart options etc. This script makes
things super handy in the future.
My Own Docker Image
From the previous work, I had written all the code to collect the data from the Davis Airlink. I had to alter the code from being called by promtetheus to have a push to the InfluxDB. As part of Influx's set up, they offer very straight forward ways to push data, and you simply pick the language you want to use and run the tutorial. I had data flowing into Influx very quickly and give mad props to the Influx developers for this tutorial. Combined with the NPM module, node-schedule, I had data flowing into Influx from the Airlink in under an hour.
Visual Studio Code made making a Docker image pretty easy. With the Docker components installed (which prompt you to install them if Docker is running on your computer), you can simply build the image which shows up right in the Docker UI. I looked into using Docker Hub but quickly found out that it's too expensive for hobbiests with one or two images to manage. Feel free to tell me I'm wrong! Once this was complete, new data would flow into InfluxDB, and Grafana would read that data.
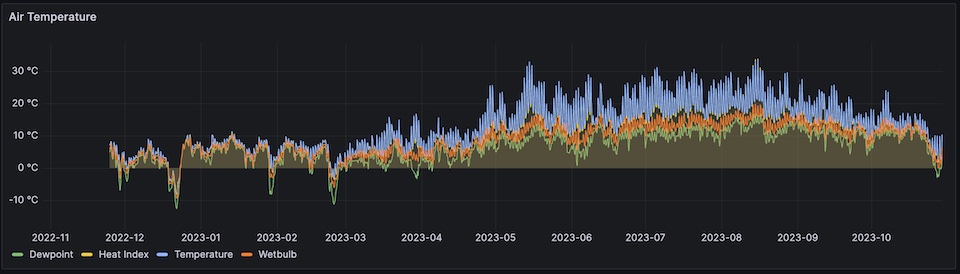
Saving the Data
Last but not least, I had almost a years worth of data in Prometheus, it would be a shame to start over given the data was right there. Using the NPM module Prometheus Query, I was able to write a quick program that would query Prometheus and save the data into InfluxDB. After this program ran, it took a good 10 minutes for a year of data to be visible to Grafana at 5 minute intervals.
Monitoring Docker turned out to be trickier than I thought. I was hoping I could just configure the host to alert me if a docker image stopped, but this was not the case. As such, monitoring is still a work in progress.